Feed conversion ratio on its own rewards the wrong thing. A crop can post an excellent FCR by being harvested light, or by losing the weaker birds early so the survivors flatter the average. FCR does not know how many birds died, how heavy they got, or how long it took.
The Production Efficiency Factor — PEF, also written EPEF — exists to close that gap by combining all four:
PEF = (liveability % × average live weight in kg × 100) ÷ (age in days × FCR)
Every term pushes in the direction you want. Birds that live, get heavy, get there quickly, and eat less doing it all raise the number.
A worked example
A crop processed at 35 days, 5% total mortality (so 95% liveability), averaging 1.90 kg, with an FCR of 1.65:
(95 × 1.90 × 100) ÷ (35 × 1.65) = 18,050 ÷ 57.75 = 312
A weaker crop the same age — 7% mortality, 1.85 kg, FCR 1.70 — gives 289. Same house, same length of cycle, and the single number separates them immediately in a way FCR alone would not.
Now the part that causes arguments
The formula is universal. The rating scale is not, and this is where comparisons go wrong.
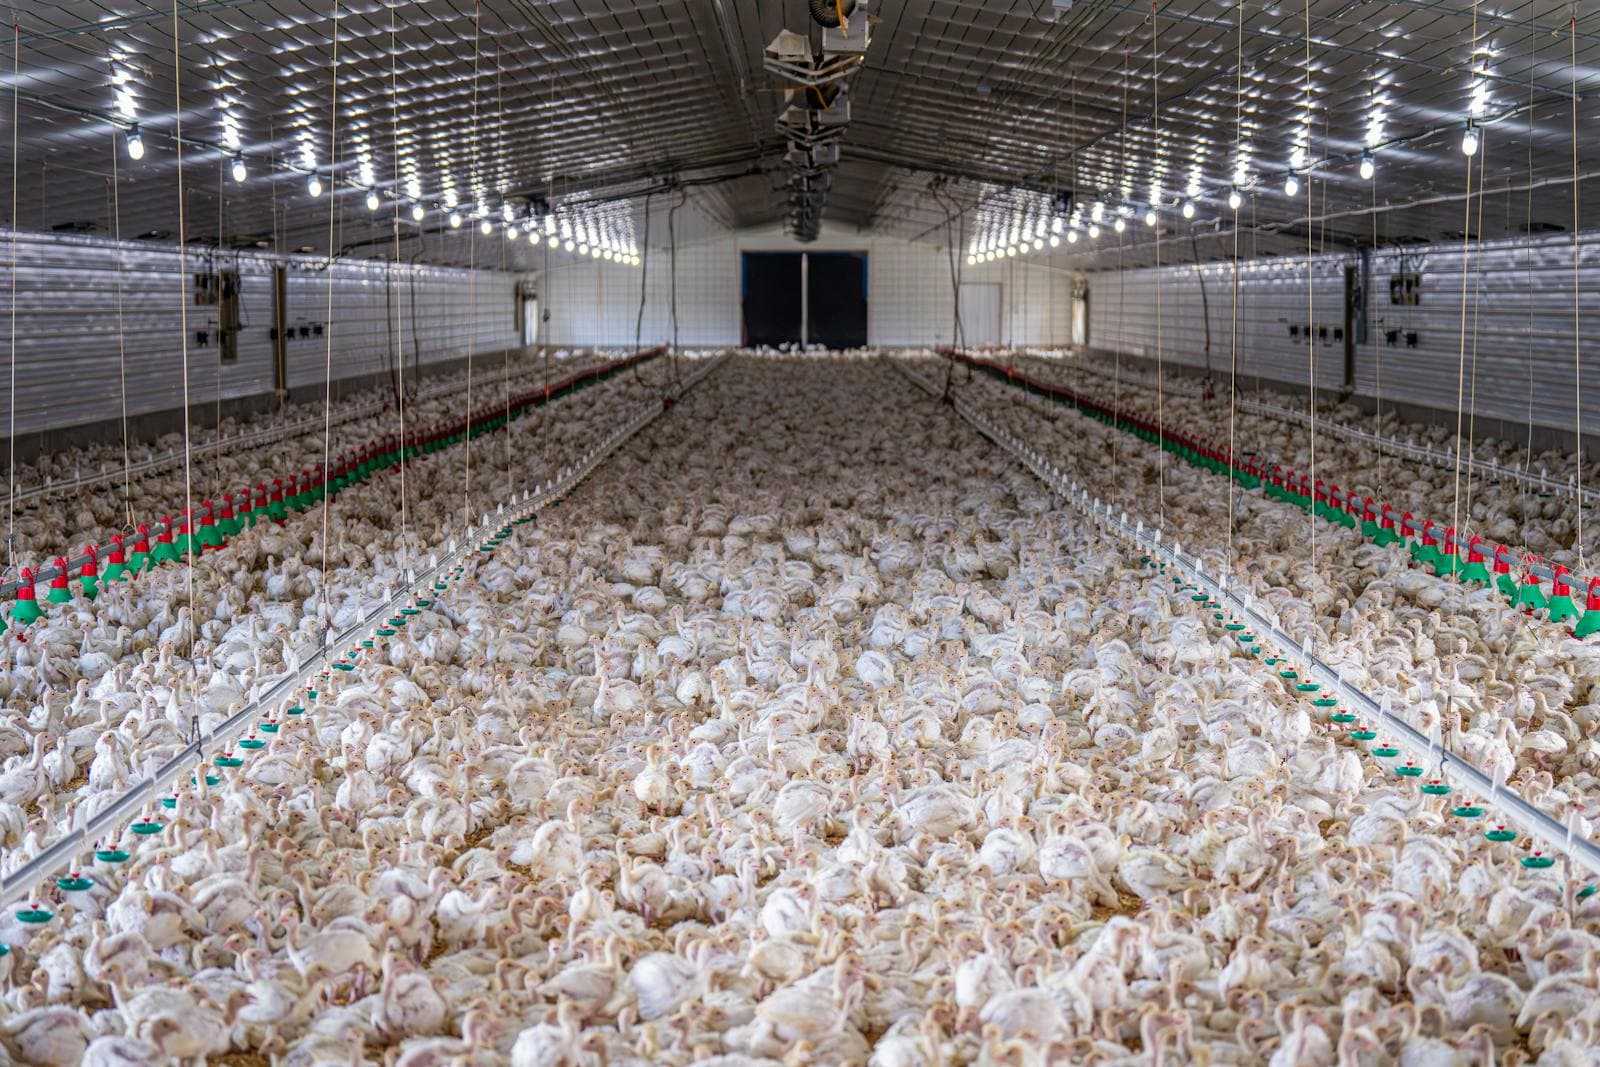
Search for a PEF benchmark and you will find figures that flatly contradict each other. Guidance written for intensive, environmentally controlled housing commonly treats 300 as the target and 400 or above as high performance — the primary breeding companies run recognition schemes at that level, and scores above 480 are rare anywhere in the world.
Meanwhile a rating table printed for smallholders using open-sided housing in a warm climate may class anything above 280 as excellent.
Both are correct. Neither is wrong. They describe different production systems, and a controlled house with managed temperature, ventilation and stocking simply achieves things an open shed in a hot summer cannot.
What that means for you
A PEF of 285 is a disappointing result in a controlled house in a temperate climate and a very good one in an open-sided shed in January. If you take a benchmark written for one system and apply it to the other, you will either congratulate a mediocre crop or tell a genuinely good farmer they are failing.
So:
- Compare yourself to your own previous crops first. Same house, same season, same strain — that comparison is always valid and needs no external table.
- When you use an external benchmark, check what housing it was written for. If it does not say, be sceptical of it.
- Compare across farms only within the same system. Open-house to open-house, controlled to controlled.
- Watch the direction more than the level. Three crops trending from 250 to 275 is a farm getting better, whatever any table says about 275.
PEF will not tell you what to fix
It is a scoreboard, not a diagnosis. A low PEF only says one of the four terms is dragging, and you need the underlying records to know which:
- Liveability low? Look at brooding, chick quality at placement, and the mortality curve's shape — early losses and late losses have different causes.
- Weight low for age? Feed availability, water, house temperature, stocking density.
- FCR high? Feed wastage, spillage, a cold house making birds eat for warmth rather than growth.
- Age high? Sometimes a market decision rather than a fault — but it costs you on the index either way, so it should be a decision and not a drift.
This is also why PEF is worth computing every crop rather than occasionally. One number is a data point; a run of them is a trend, and the trend is what actually tells you whether the changes you made worked.
Where PEF does not belong at all
An efficiency index describes a crop grown to a target weight on measured feed. A scavenging or free-ranging village flock is not that, and scoring one on a broiler index is a category error, not a low score. Those systems need birds, losses, eggs and sales — and judging them by an index designed for something else tells you nothing useful.
FuroTrack calculates PEF from the records you already keep and judges it against the benchmark range for your production system, not a single global table.
Ready to try FuroTrack on your farm?
Create a free account without a payment card and set up your first farm records.
Start free